A VIX for APAC: Building a regional volatility benchmark

Despite the growing popularity of Asia-Pacific markets, investors in the region lack a volatility benchmark on par with the Cboe Volatility Index or the Euro Stoxx 50 Volatility Index. We believe the Nikkei Stock Average Volatility Index (NKVI) is the most promising candidate to become a leading gauge for APAC. However, to date, methodological shortcomings in the way NKVI futures (the associated product of the NKVI) are calculated have limited its appeal. We believe this can change, and we outline below a series of recommendations to enhance the robustness of NKVI futures.
Volatility indexes and their associated products have exploded in popularity in recent years, spurred by the Covid-19 pandemic, monetary policy tightening and geopolitical risk. Products linked to the Cboe Volatility Index (VIX) trade in the billions of dollars each day, while the level of the “fear gauge” is frequently quoted alongside leading benchmarks in the financial media. In Europe, the Euro Stoxx 50 Volatility Index (VSTOXX) supports a well-developed ecosystem of futures and options products and underpins numerous other exchange-traded and structured products.
But despite success in the US and Europe, investors in the Asia Pacific region (APAC) lack a volatility gauge of similar prominence for their local markets. Shortcomings in existing volatility index products, particularly in the way settlement prices are calculated, have limited their appeal to many institutional investors. But developing a liquid and robust volatility gauge (and associated futures market) is far from impossible. In fact, it would be a highly desirable outcome for both regional investors and the exchanges involved.
“As a large asset manager focused on equity index volatility, in particular in Asia, we would welcome increased liquidity in the NKVI and other Asian volatility futures. The main issue is that the current methodology for NKVI and the related futures makes it difficult for us and other institutions to get comfortable trading the products. Improvements there would go a long way toward opening up this important market to more investors.”
Govert Heijboer, Co-CIO at True Partner Capital
We believe that among existing APAC volatility benchmarks, the Nikkei Stock Average Volatility Index (NKVI) has the best chance of becoming the leading gauge for the region. However, in order to facilitate this, Osaka Exchange (OSE) should implement methodological changes to the final settlement price (SQ) of NKVI futures to bolster trust and confidence among market makers and investors. In the table and further below, we outline ways to achieve this.
Background
A volatility index is a real-time gauge representing the market’s expectations of volatility for a certain period of time (usually 30 days) into the future. The most well-known examples are the VIX, which measures the 30-day implied volatility of the S&P 500 Index, and the VSTOXX, which tracks a similar measure for the Euro Stoxx 50 benchmark.
Institutional investors use volatility index products for a variety of reasons, but the most obvious use case is for investors who want to trade the volatility of the market itself. These include volatility funds, macro funds, structured product issuers and proprietary trading firms.
Other market participants who make use of volatility index products are options market makers, who use them as risk-management tools. The gauges can also serve as important indicators of short-term price activity and market sentiment.
Volatility indexes are typically calculated by averaging options prices on benchmark stock indexes, though methodologies vary. Broadly speaking, the VIX is calculated using snapshots of bid/ask quotes for S&P 500 options taken every 15 seconds, while the VSTOXX uses snapshots taken every 5 seconds of market prices for all Euro Stoxx 50 options within a given time to expiry.
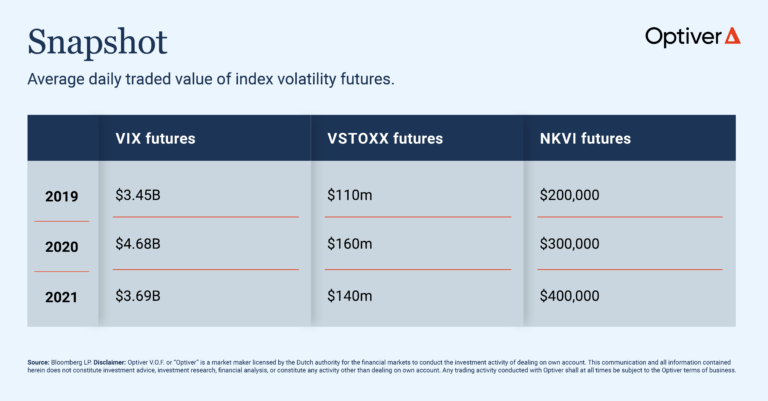
Popular volatility indexes support deeply liquid derivatives markets. For instance, the average daily trading value of futures on the VIX is approximately $3.7 billion, while the average daily trading value for VIX options is approximately $1.1 billion. For the exchanges involved in developing these products, they can play a key revenue generating role and even serve as flagship products.
Current Landscape in APAC
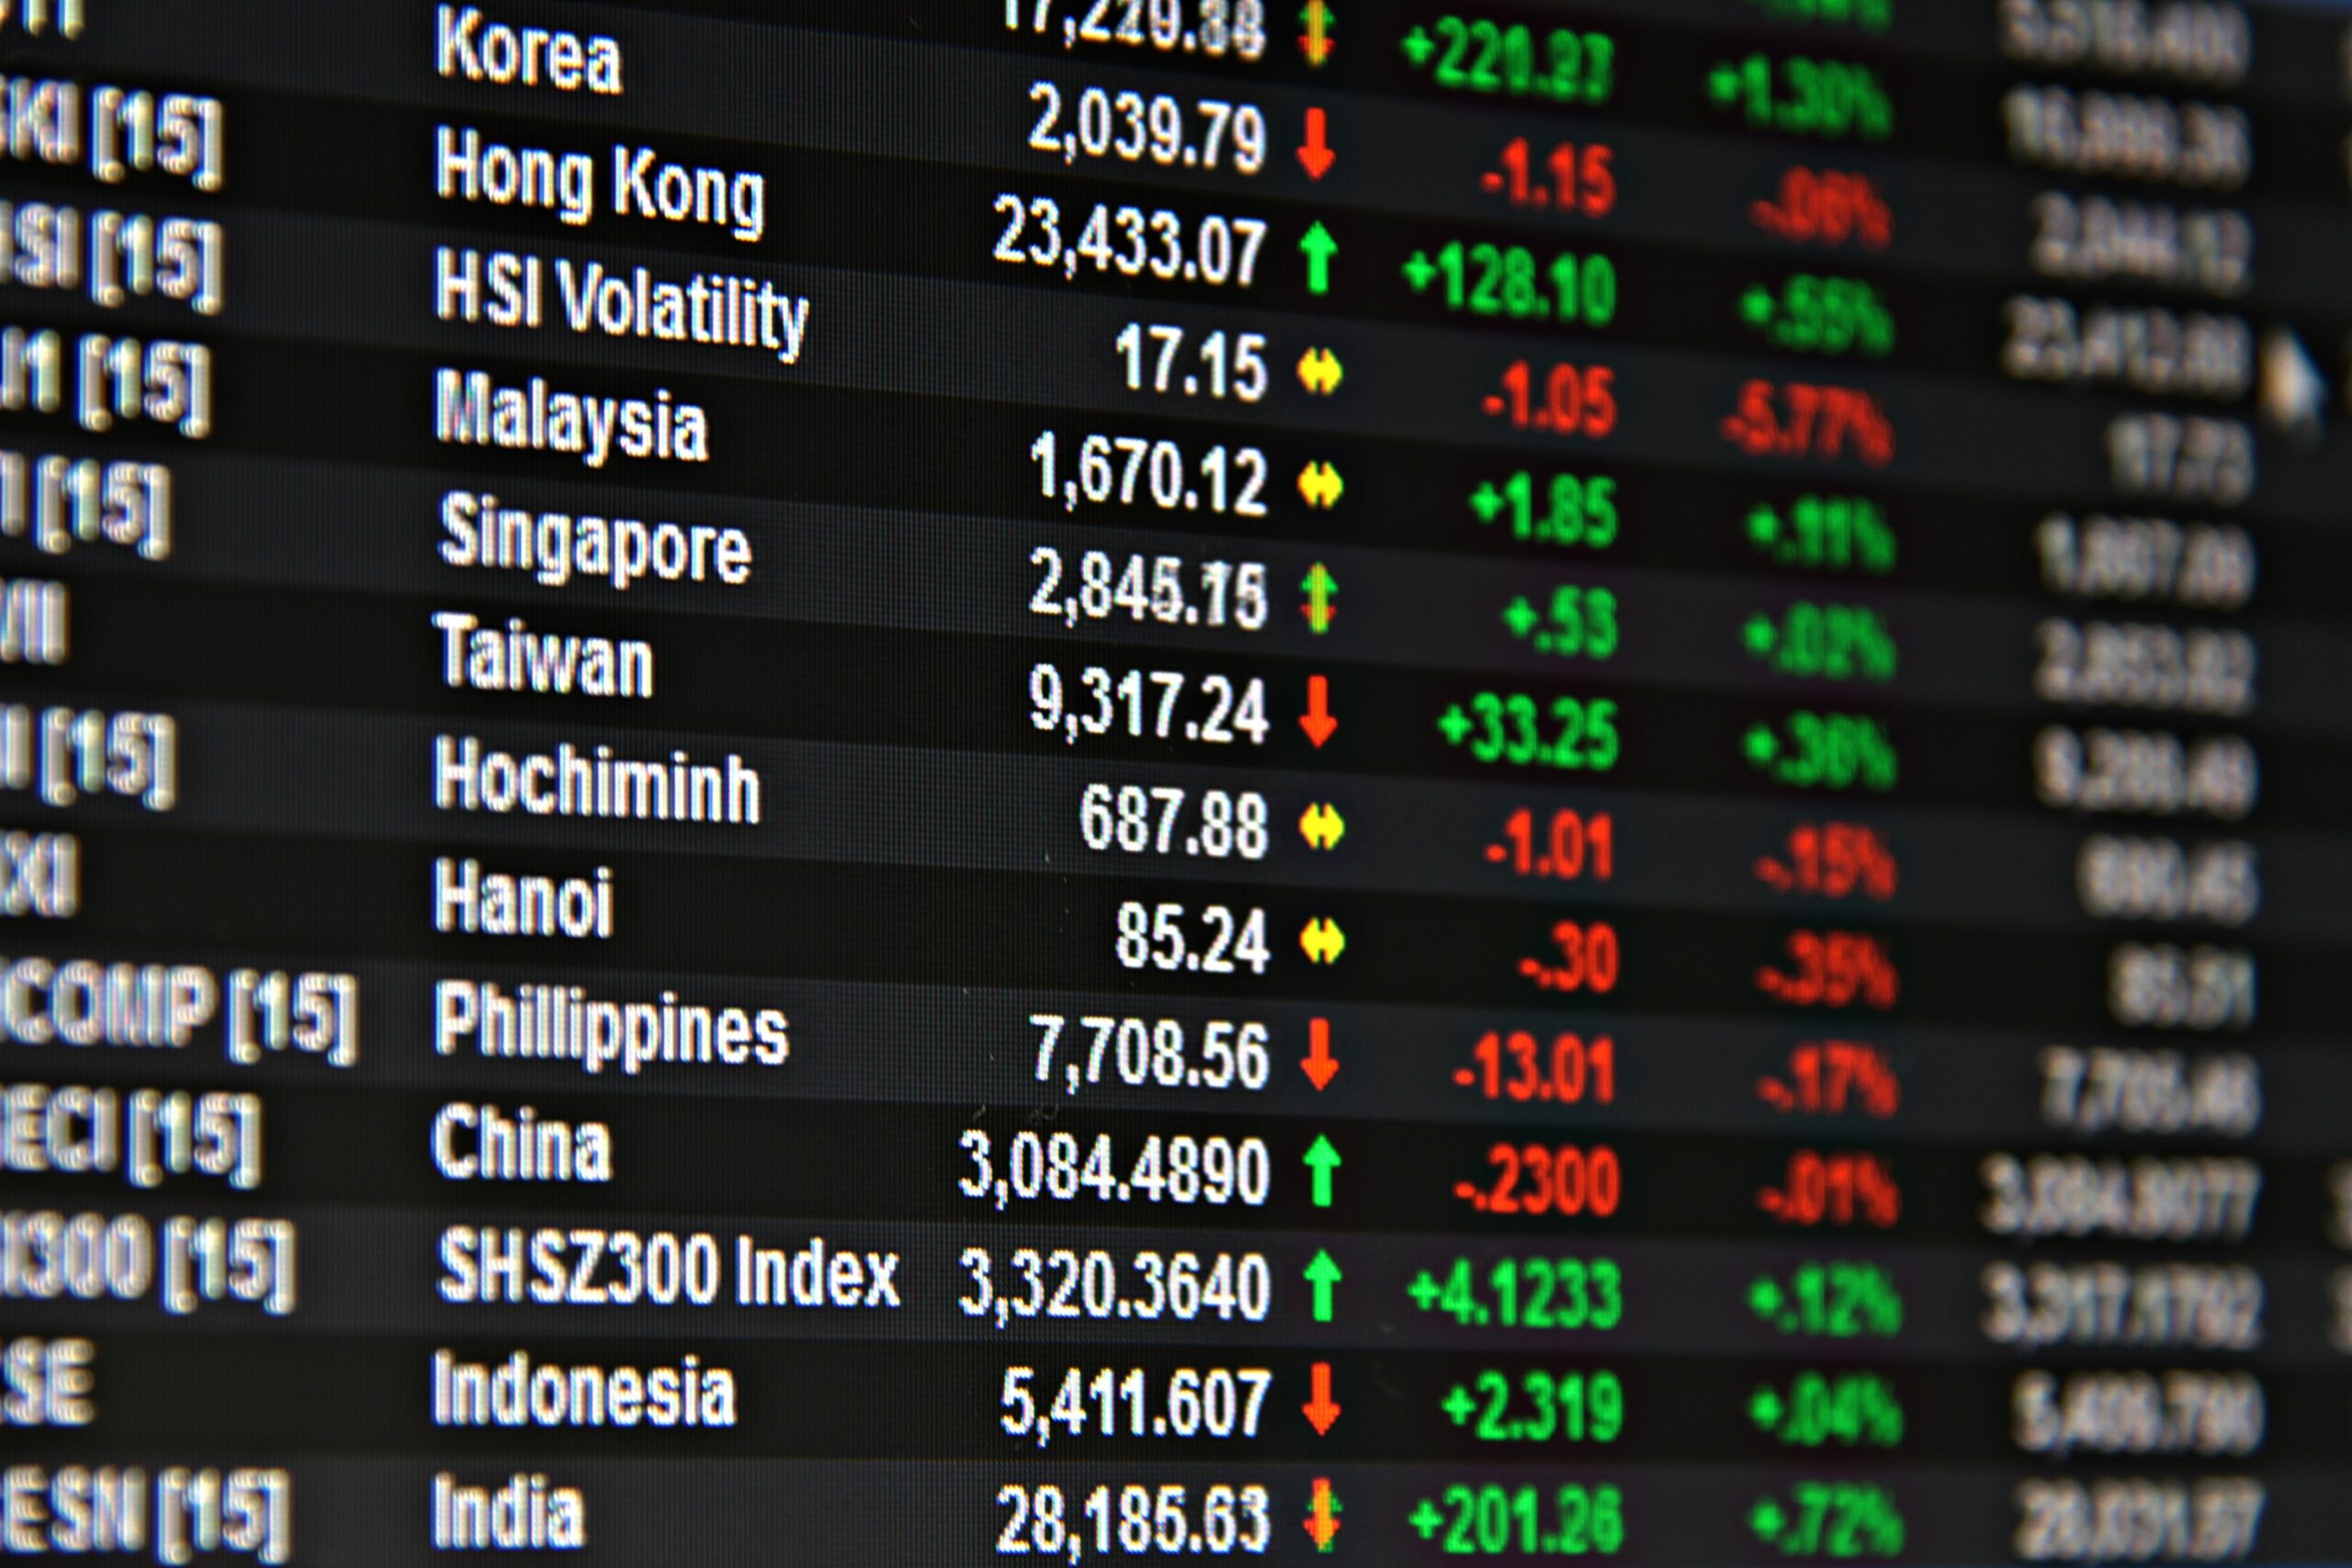
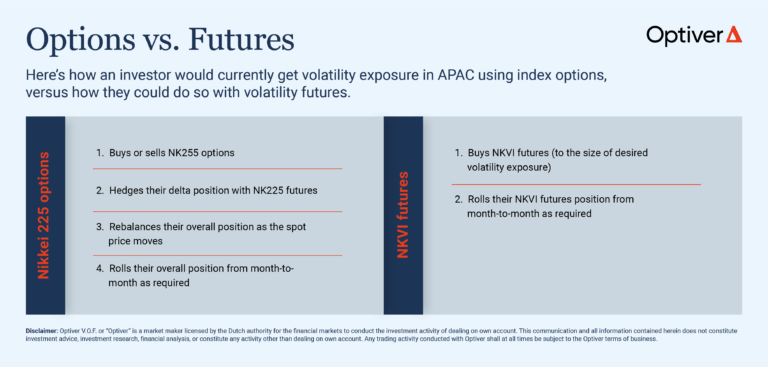
In the APAC region, the Nikkei 225 (NKY) has long been seen as the benchmark equity index due to the way it reacts to major macroeconomic themes and headlines. Nikkei Indices currently calculates the NKVI, which measures the 30-day implied volatility of the NKY based on options prices. OSE lists NKVI futures, which have an average daily trading value of approximately $400,000. Currently, most institutional investors who trade volatility in the region get their exposure not through the futures but through NKY options, which among other drawbacks require rebalancing as spot prices move.
Volatility gauges also exist for the benchmark stock indexes in Korea, Hong Kong and Australia. However, none of these products are sufficiently liquid for most institutional investors, which suggests the first mover will have a significant advantage.
Where Can It Go?
We believe it makes sense to develop the NKVI into a regional standard on par with the VIX or VSTOXX. We see the Japanese market as possessing the greatest appeal for institutional investors in APAC, particularly those who trade the volatility of the market itself. We also feel that with some adjustments, NKVI futures can become the leading tradable volatility instrument for the region.
The growth potential for these products is clear. In 2021, the average daily traded value (ADTV) of VIX futures clocked in at 0.63% of ADTV in S&P 500 options, while in Europe, VSTOXX futures traded at ADTV equivalent to 0.3% of EuroStoxx 50 options. In Japan however, NKVI futures traded at ADTV equivalent to just 0.003% of NKY options, or over 200 times less than the level in the U.S. Other volatility benchmarks throughout Asia are similarly underdeveloped.
Our Recommendations
In order for NKVI futures (and associated options) to succeed, OSE must ensure it’s offering a product that is sound and predictable for investors and market makers to trade. A major criticism that has been leveled at NKVI futures is the way OSE’s final settlement price (SQ) is calculated.
Market makers have historically been unwilling to provide liquidity of any depth due to concerns that SQ is vulnerable to being settled at a value that doesn’t represent the underlying volatility of the index. This lack of liquidity has in turn made investors hesitant to trade the products and opt for NKY options instead. Alleviating these concerns for NKVI will in our view increase liquidity and trading volumes in the entire Nikkei 225 derivatives complex.
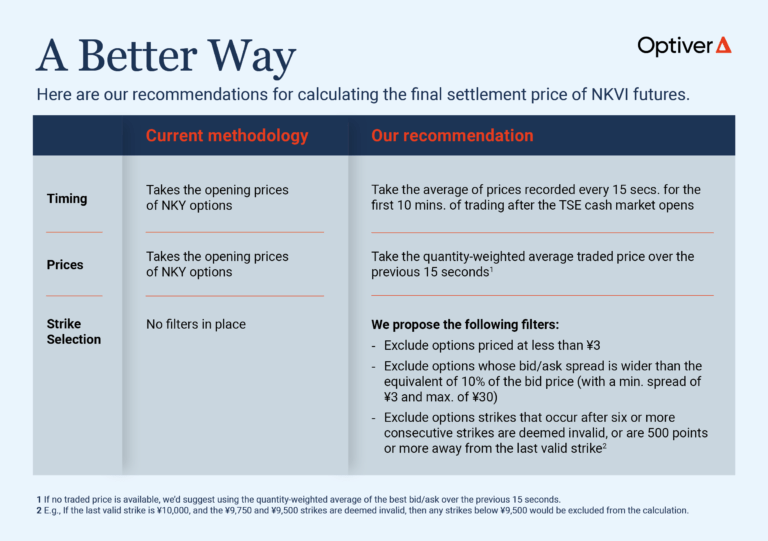
We believe these issues can be resolved by adjusting the way SQ is calculated. In particular, we propose the following amendments to the methodology when calculating SQ for NKVI futures (see also table above):
- Timing – Currently, SQ is calculated using solely opening prices of NKY options. We suggest expanding this to take the average of prices recorded every 15 seconds for the first 10 minutes of trading after the Tokyo Stock Exchange cash market open (40 snapshots in total).
- Prices – As stated above, SQ currently takes into account solely opening prices. Our preference would be for the calculation to take the quantity-weighted average traded price over the previous 15 seconds instead. If no traded price is available, we’d suggest using the quantity-weighted average of the best bid/ask over the previous 15 seconds.
- Strike selection – Currently there are no filters in place to determine which options strikes are used in the calculation of SQ. We would propose the following filters:
- Exclude options priced at less than ¥3;
- Exclude options whose bid/ask spread is wider than the equivalent of 10% of the bid price (with a minimum spread of ¥3 and maximum of ¥30);
- Exclude options strikes that occur after six or more consecutive strikes are deemed invalid, or are 500 points or more away from the last valid strike (e.g., if the last valid strike is ¥10,000, and the ¥9,750 and ¥9,500 strikes are deemed invalid, then any strikes below ¥9,500 would be excluded from the calculation).
Finally, we feel that the OSE could also make improvements to its strike listing methodology, which would benefit both NKY options as well as the SQ for NKVI futures. We understand that OSE is working through some potential changes, and we support them in this effort.
Conclusion
A highly liquid volatility index in APAC would enable a wide range of investors to more easily trade the volatility of the market itself. It would also benefit the exchanges involved in terms of both revenue from the products and the associated branding. For OSE and Japan Exchange Group, a successful volatility product could boost the popularity of related exchange-traded funds, futures, options and potentially even stocks.
Our view is that Japan is the most attractive market in APAC for volatility investors, and Optiver is pleased to support OSE in their efforts to grow the NKVI future into the regional volatility benchmark product.
Optiver supports open discussion and debate on all market structure topics that would lead to an improvement of the market.
To discuss this paper – or any other market structure topic – reach out to the Optiver APAC Corporate Strategy team via [email protected]
DISCLAIMER: Each of Optiver Australia Pty Limited ABN 54 077 364 366 AFSL 244145, Optiver Trading Hong Kong Limited APO583, Optiver Taiwan Futures Co., Ltd F034, Optiver Singapore Trading Pte Ltd UEN 202107169R and Optiver (Shanghai) Trading Company Limited (individually and collectively, “Optiver”) is a proprietary trading firm and trades exclusively for the benefit of its own account or its’ affiliates. This communication is for informational purposes only. It is not a recommendation to engage in investment activities and must not be relied upon when making any investment decisions. This communication does not consider the investment objectives or financial situation of any particular counterparty. All investments involve risk and no portion of this document should be interpreted as legal, financial, tax, or accounting advice, and should not be construed as an offer to buy or sell, or a solicitation to buy or sell any future, option, swap, or other derivative or financial instrument. Entering into transactions with Optiver does not create or represent a customer relationship for either party. As such, none of the regulatory provisions regarding customers will apply to the transactions Optiver enters into with you. There are no warranties, expressed or implied, as to the accuracy or completeness of any information provided herein. The sources for the information and any opinions in this communication are believed to be reliable, but Optiver does not warrant or guarantee the accuracy of such information or opinions.